

Journal of System Simulation ›› 2023, Vol. 35 ›› Issue (9): 1948-1964.doi: 10.16182/j.issn1004731x.joss.22-0554
• Papers • Previous Articles Next Articles
He Yulin1,2( ), Chen Jiaqi2, Xu Hepeng2, Huang Zhexue1,2, Yin Jianfei2
Received:2022-05-25
Revised:2022-07-28
Online:2023-09-25
Published:2023-09-19
CLC Number:
He Yulin, Chen Jiaqi, Xu Hepeng, Huang Zhexue, Yin Jianfei. Data Generation Model-based Synthetic Sample Imputation Method[J]. Journal of System Simulation, 2023, 35(9): 1948-1964.
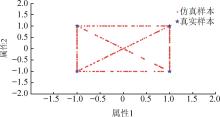
Fig. 1
Generation of SMOTE synthetic samples
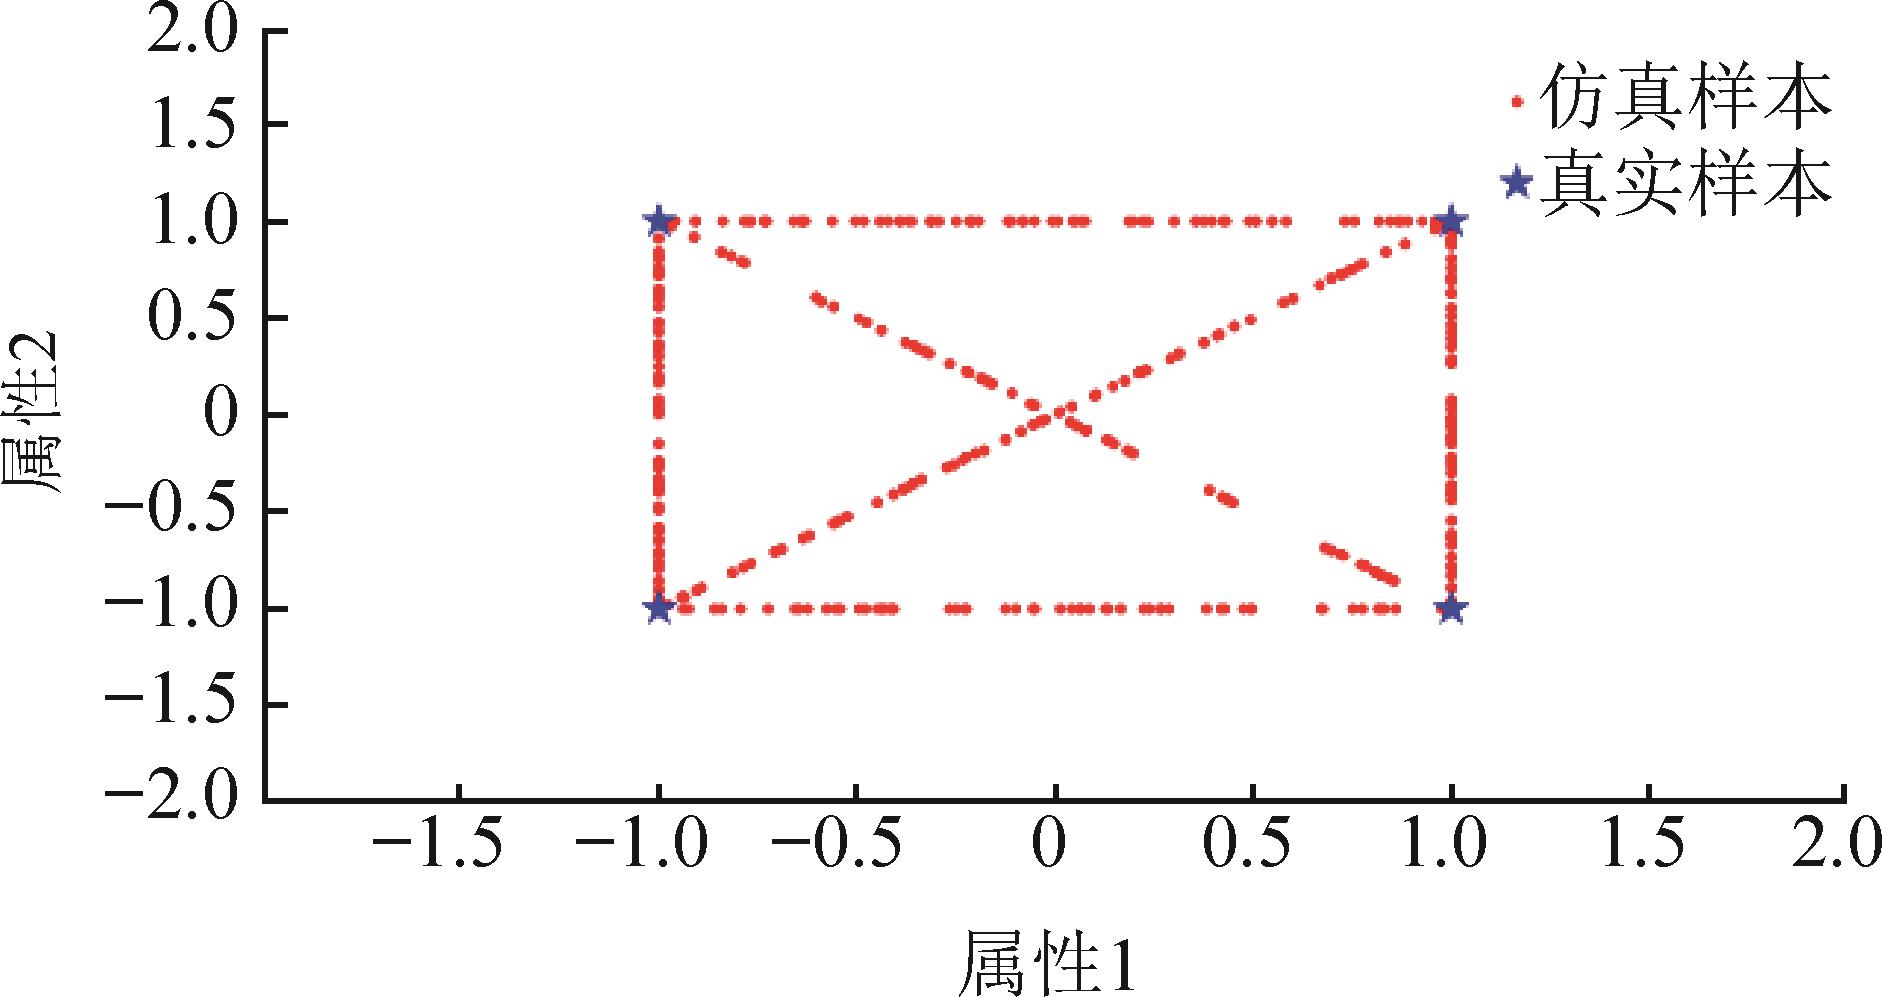
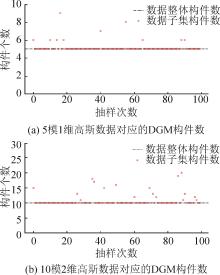
Fig. 2
Convergence of algorithm 1
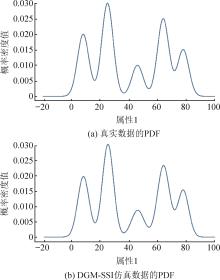
Fig. 3
Comparison of PDF corresponding to 5-mode-and-1-dimensional real data and DGM-SSI simulation data on Gaussian distribution
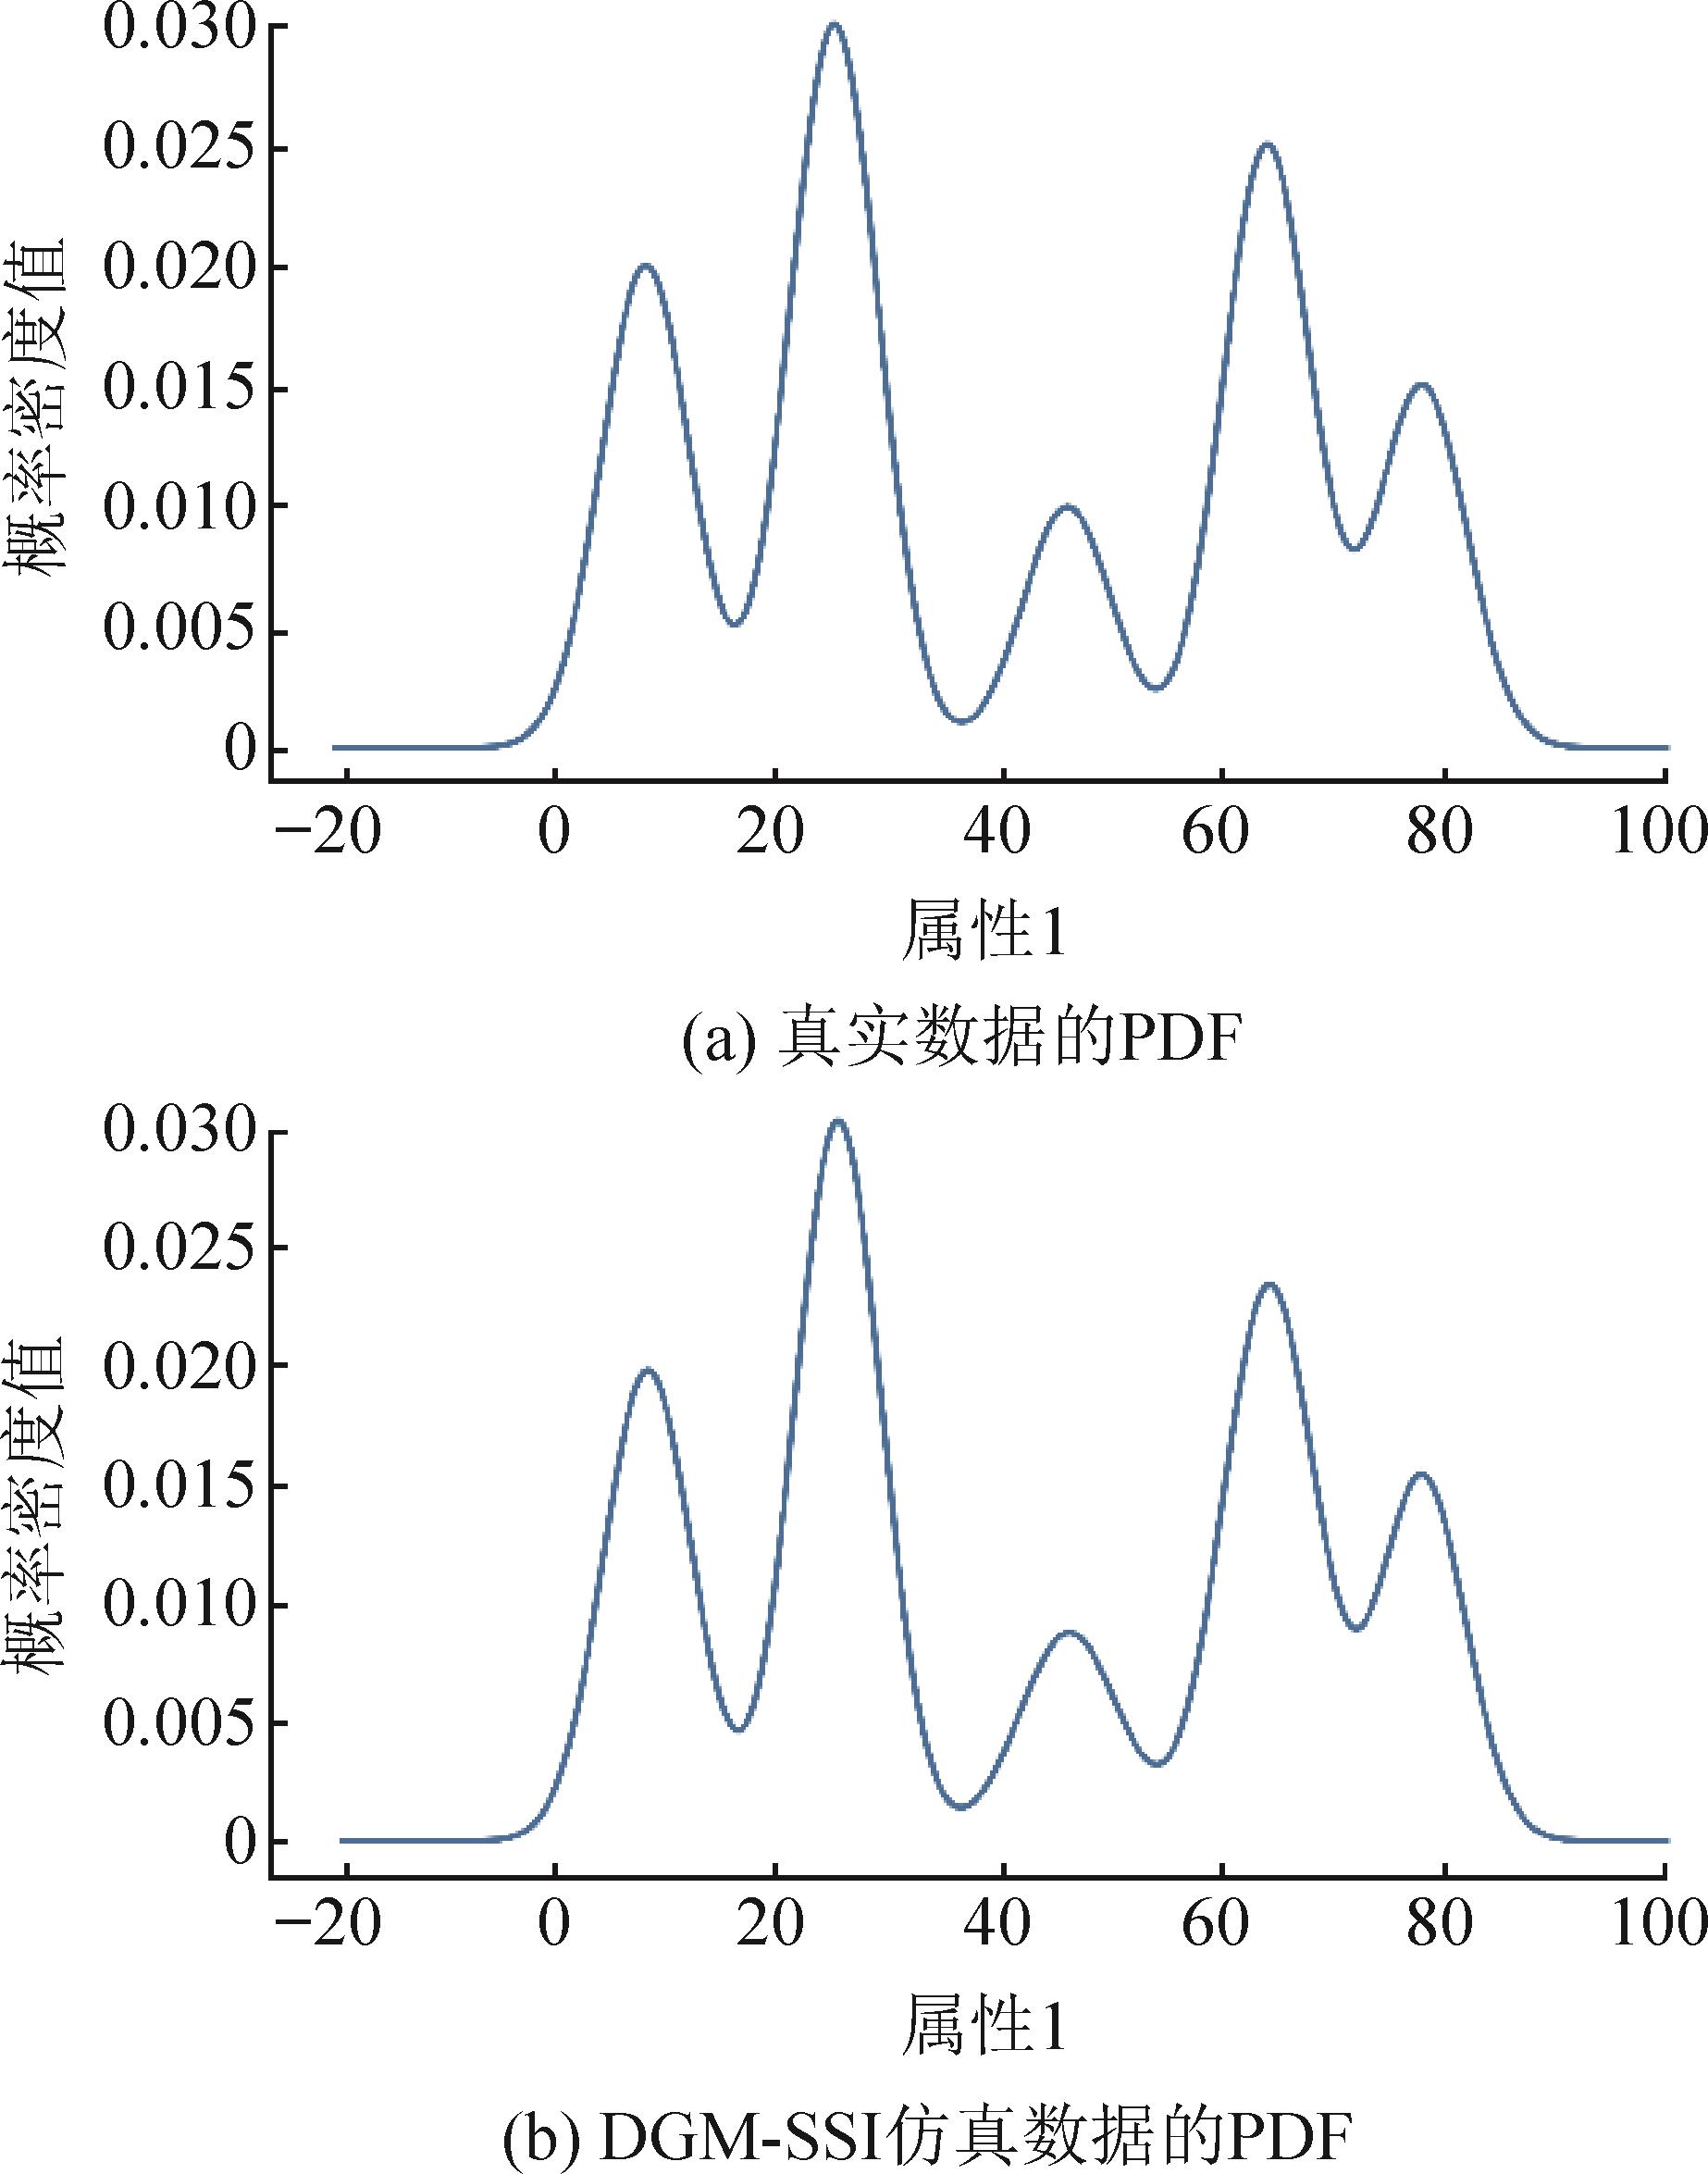
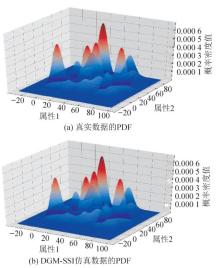
Fig. 4
Comparison of PDF corresponding to 10-mode-and-2-dimensional real data and DGM-SSI simulation data on Gaussian distribution

Fig. 5
Comparison of 10-mode-and-5-dimensional PDF of five SSI methods based on Gaussian distribution
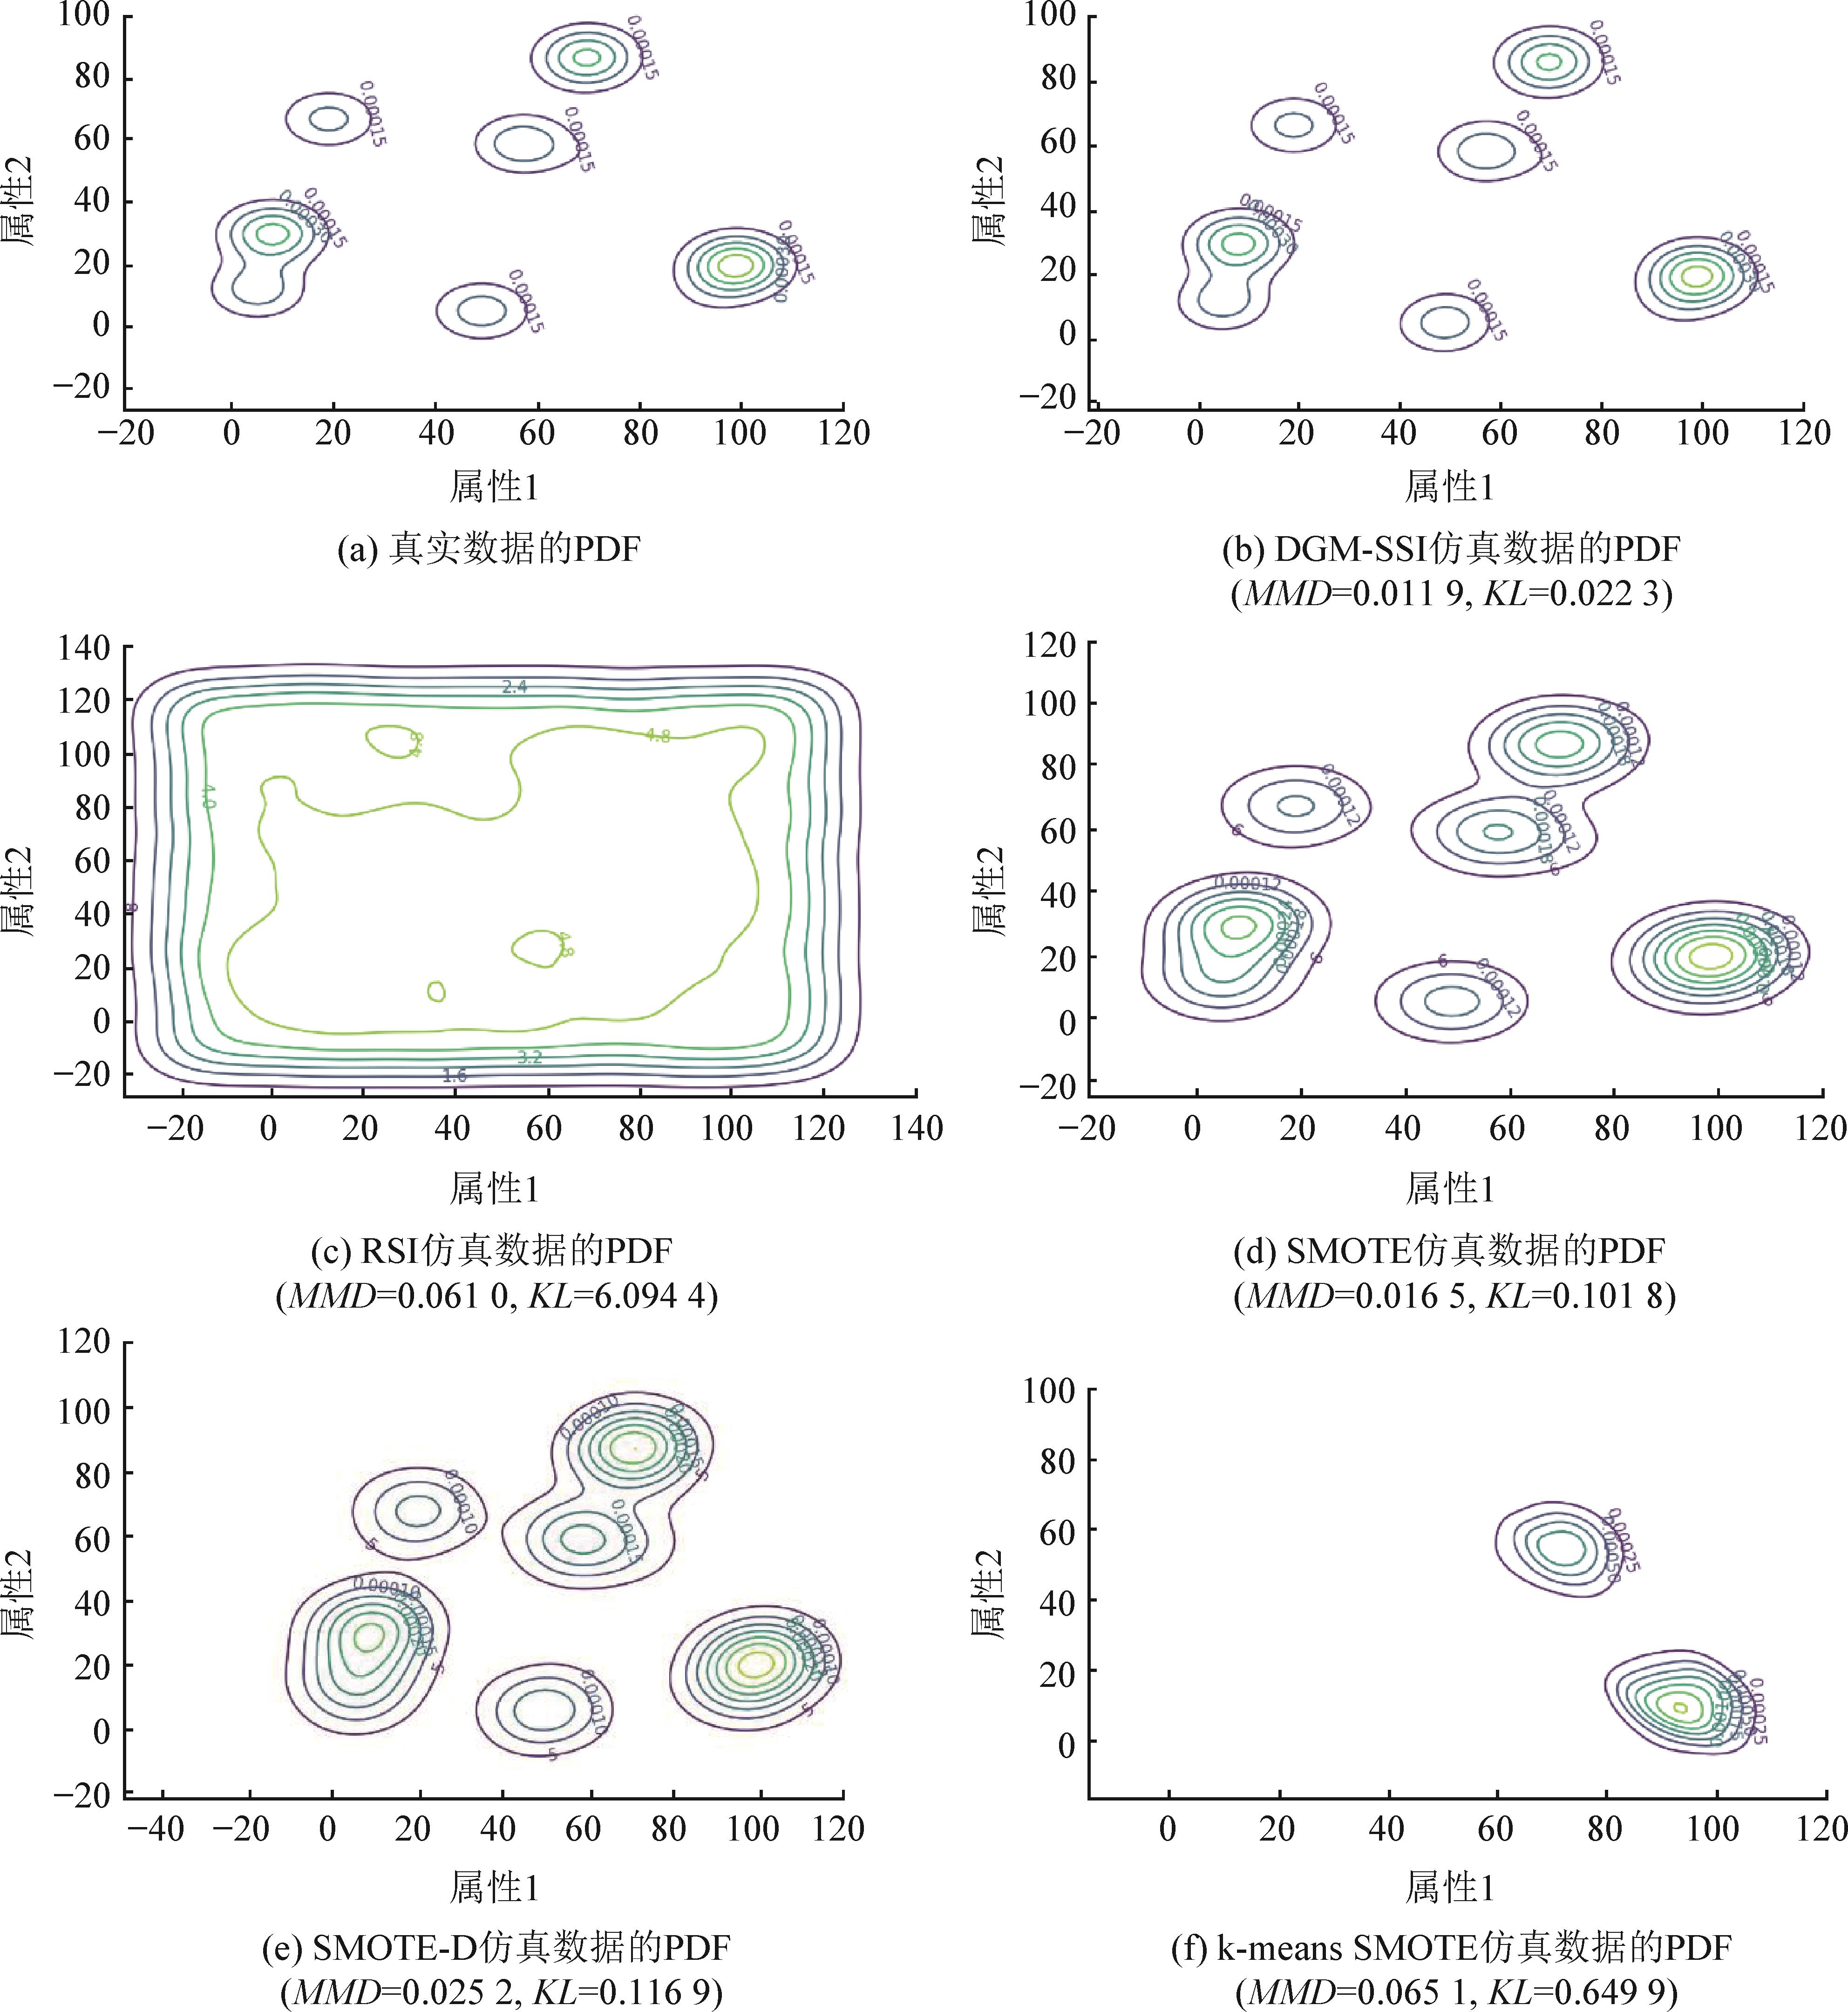
Fig. 6
Comparison of 10-mode-and-5-dimensional PDF of five SSI methods based on uniform distribution
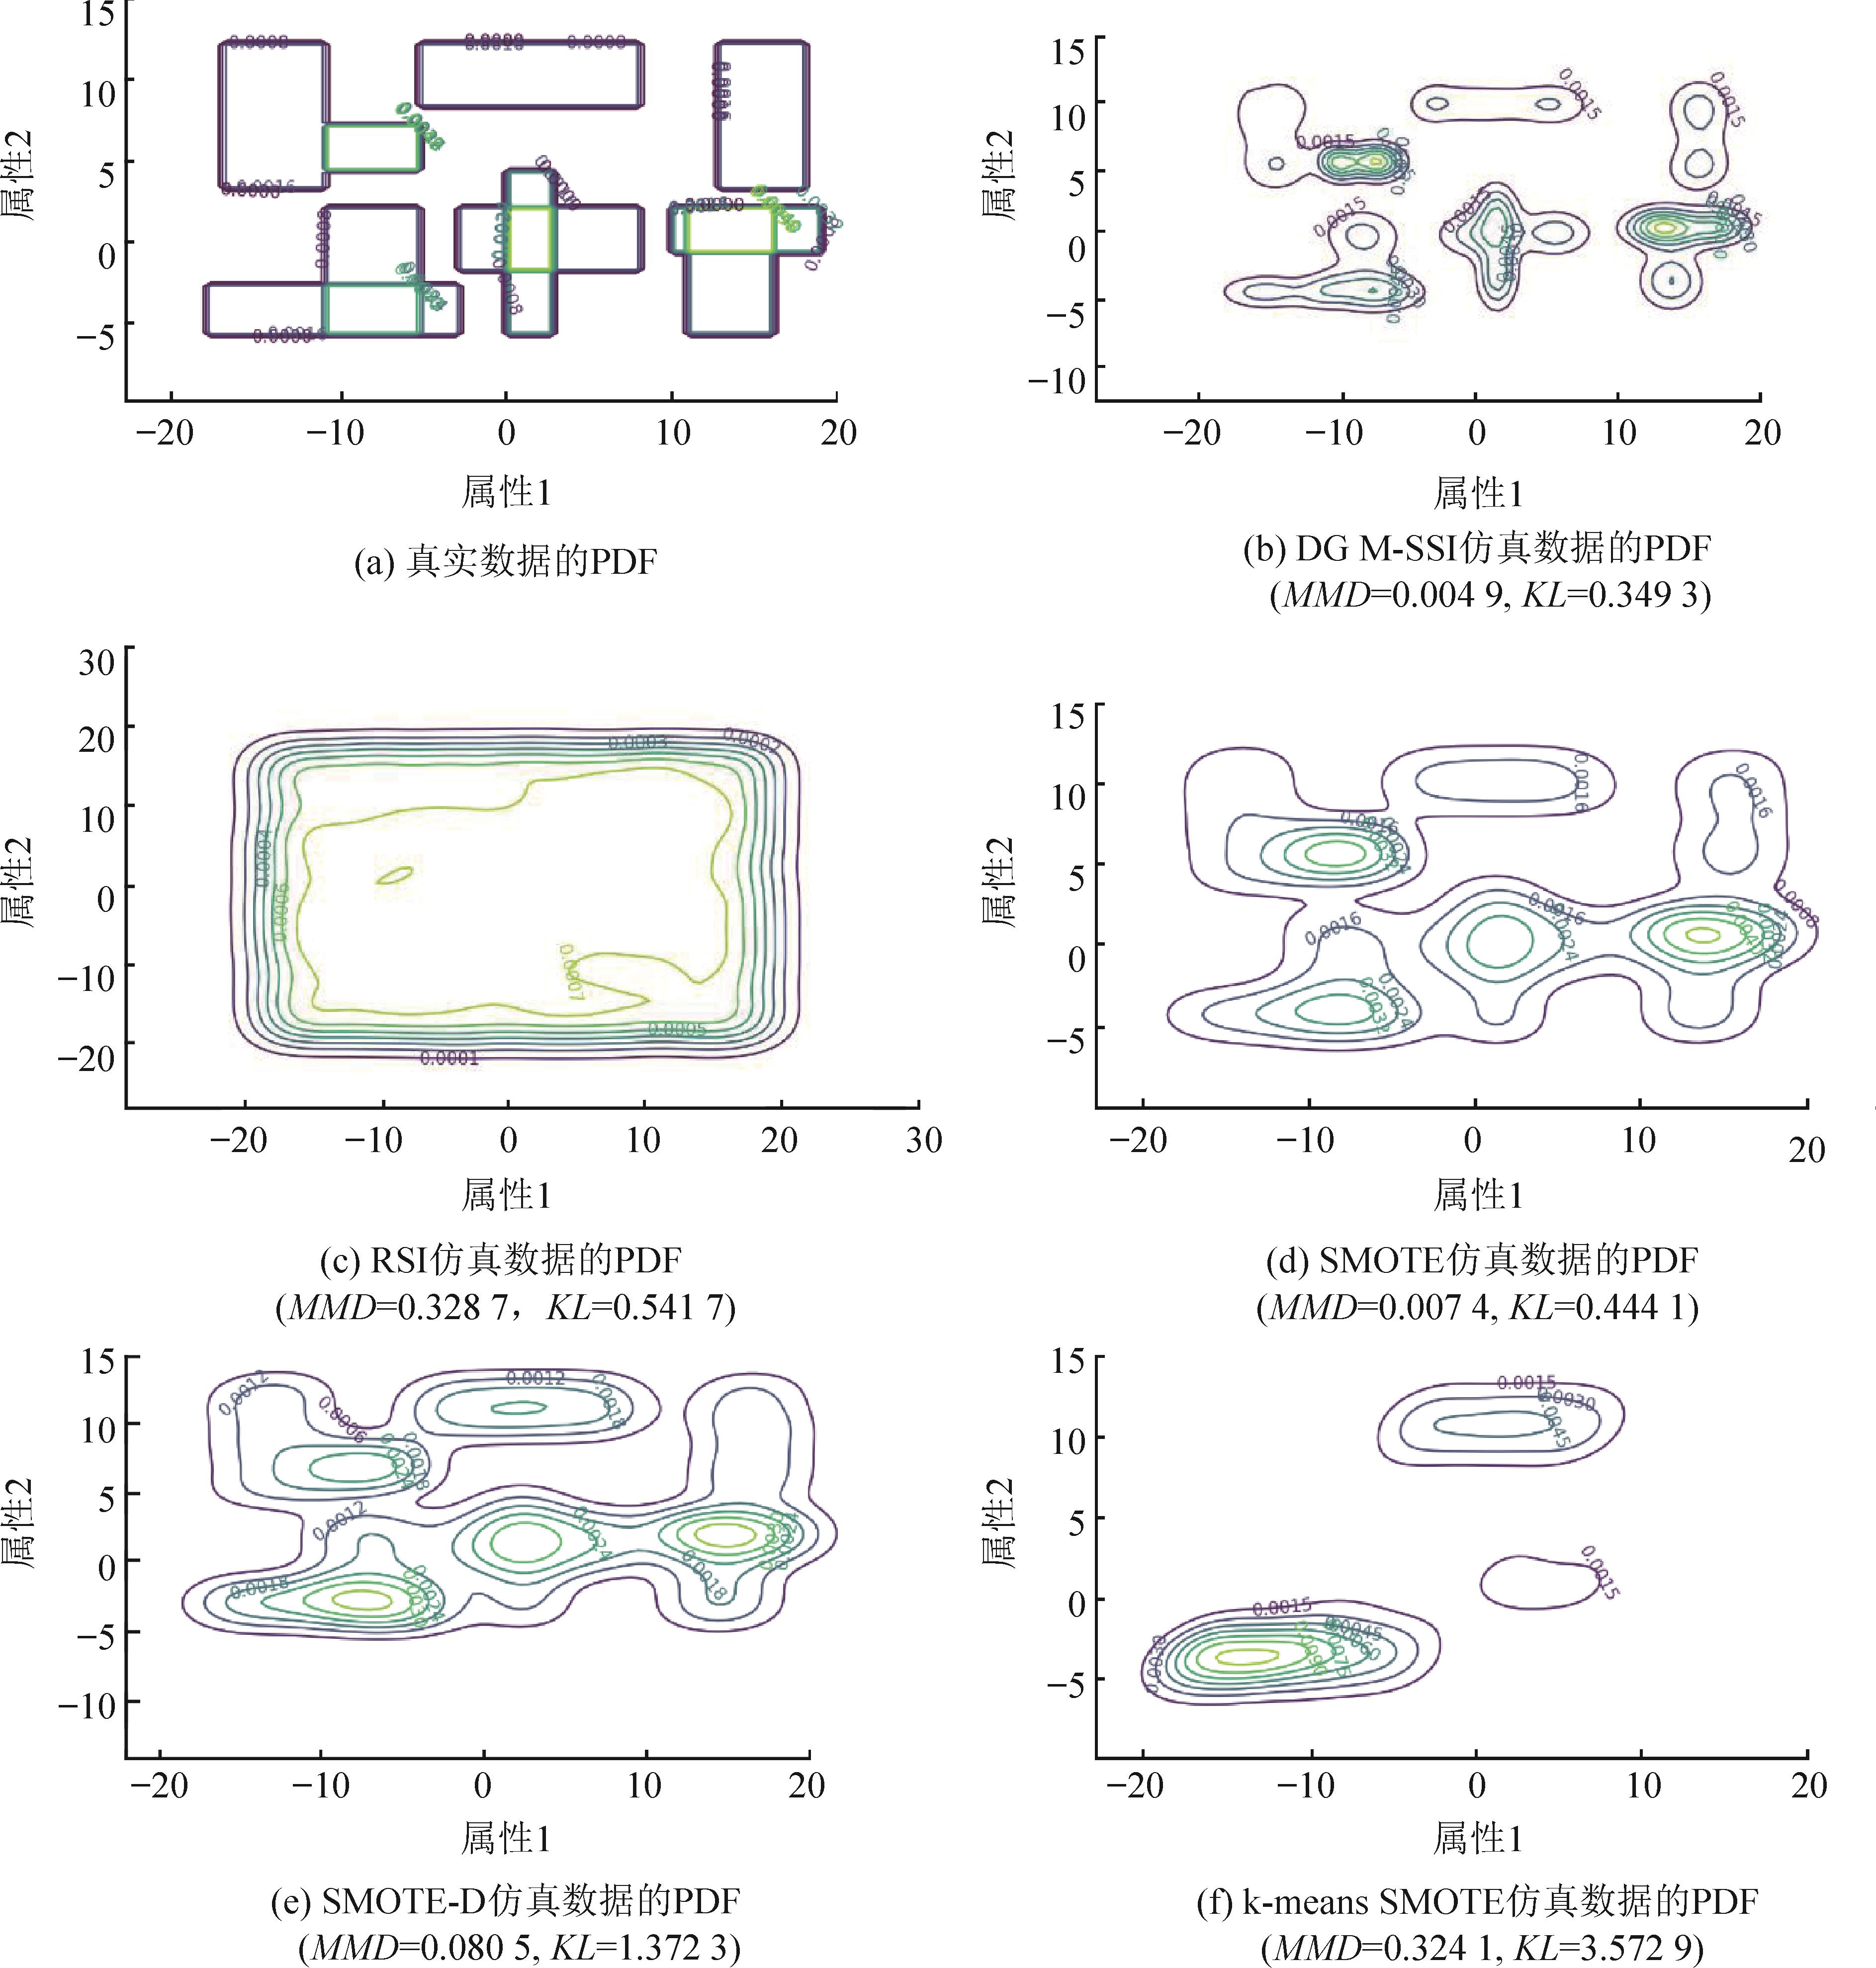
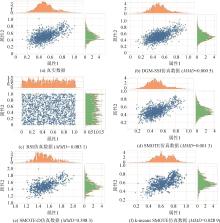
Fig. 7
Comparison of five SSI methods on Yeast dataset
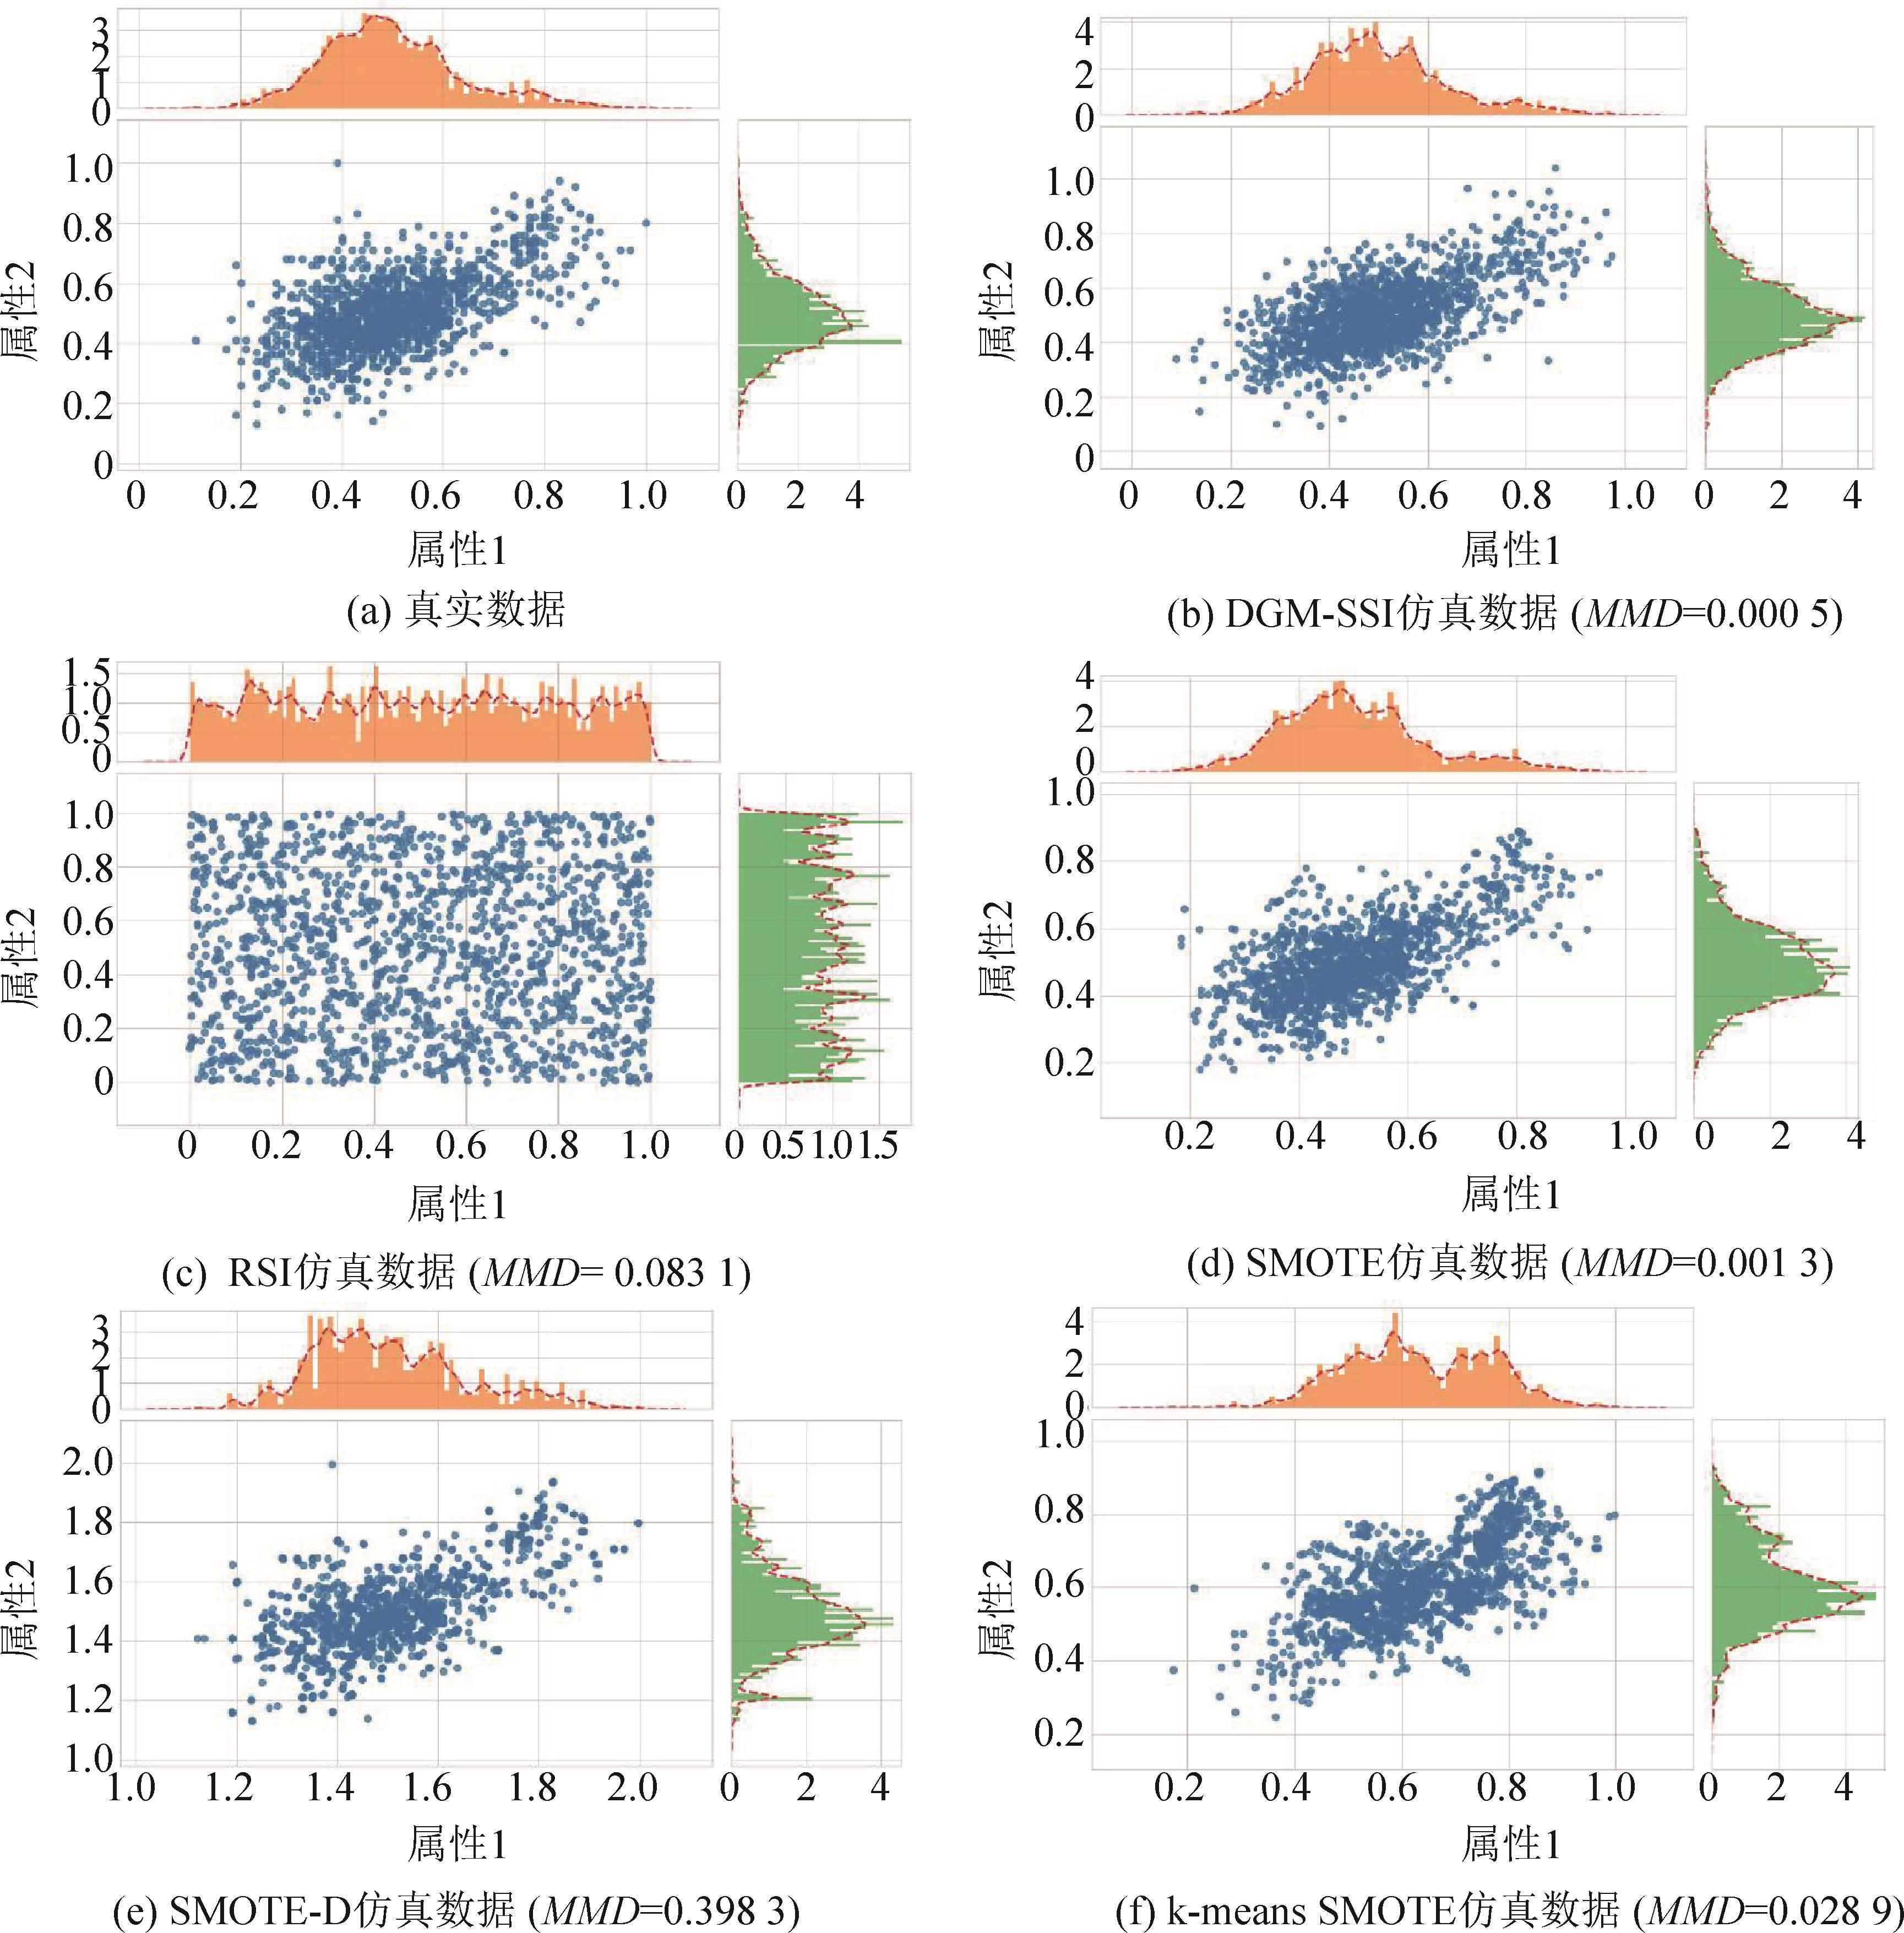
Fig. 8
Comparison of five SSI methods on Auto MPG dataset
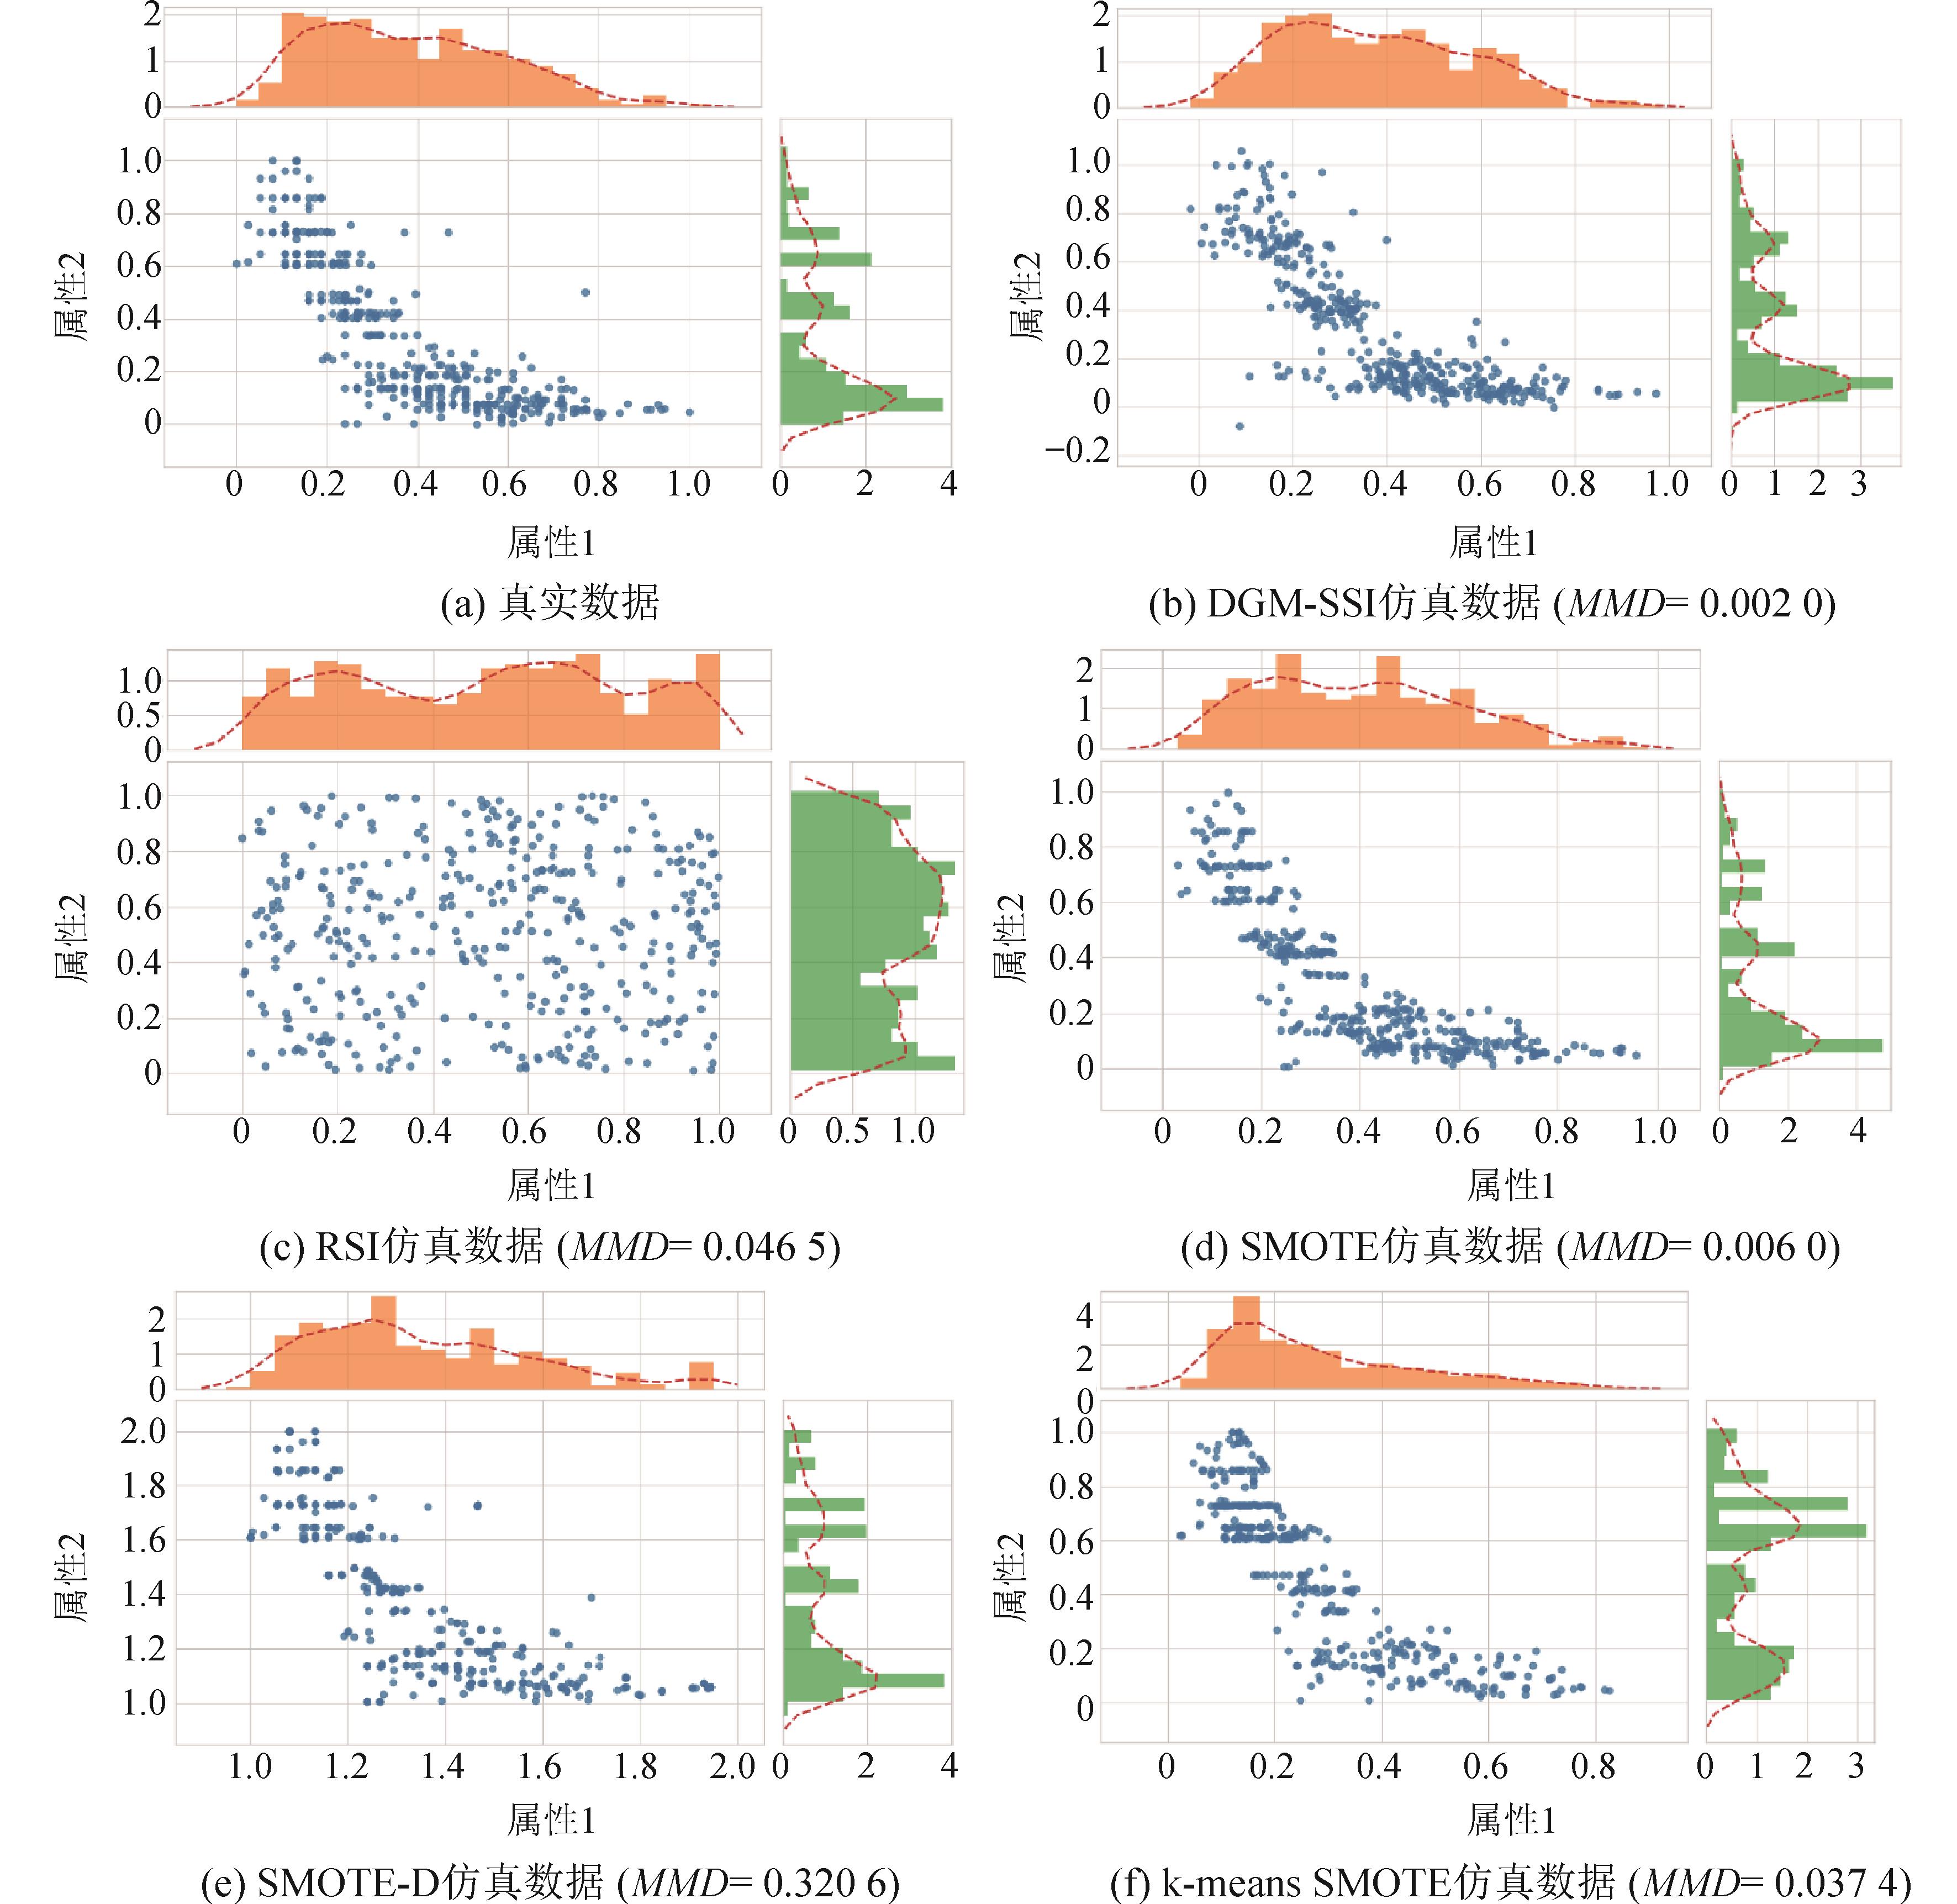
Table 1
MMD comparison of five synthetic sample imputation methods based on 10 Gaussian distributions
| 数据集 | 真实样 本点个数 | 仿真样 本点个数 | DGM-SSI | RSI | SMOTE | SMOTE-D | k-means SMOTE |
|---|---|---|---|---|---|---|---|
| 2 000 | 2 000 | 0.015 8±0.003 0 | 0.225 6±0.014 7 | 0.830 2±0.014 3 | 0.704 6±0.047 0 | 0.832 8±0.014 3 | |
| 4 000 | 4 000 | 0.012 4±0.001 0 | 0.354 1±0.001 5 | 0.892 6±0.002 7 | 0.823 6±0.014 4 | 0.892 3±0.002 2 | |
| 4 000 | 4 000 | 0.039 7±0.037 5 | 0.267 7±0.002 4 | 0.056 0±0.010 1 | 0.087 6±0.007 2 | 0.076 1±0.007 7 | |
| 8 000 | 8 000 | 0.017 7±0.004 9 | 0.136 2±0.004 6 | 0.486 0±0.003 3 | 0.394 6±0.009 1 | 0.642 8±0.012 4 | |
| 6 000 | 6 000 | 0.018 8±0.001 2 | 0.193 0±0.002 8 | 0.310 9±0.004 3 | 0.257 3±0.006 8 | 0.353 6±0.024 8 | |
| 12 000 | 12 000 | 0.012 6±0.001 6 | 0.149 6±0.000 1 | 0.410 4±0.004 9 | 0.341 7±0.006 3 | 0.412 2±0.002 5 | |
| 8 000 | 8 000 | 0.014 9±0.000 6 | 0.132 6±0.001 4 | 0.267 0±0.007 1 | 0.224 4±0.004 6 | 0.267 2±0.005 6 | |
| 16 000 | 16 000 | 0.015 4±0.003 6 | 0.081 8±0.000 1 | 0.246 8±0.002 0 | 0.208 9±0.005 9 | 0.246 7±0.001 8 | |
| 10 000 | 10 000 | 0.012 8±0.000 1 | 0.120 2±0.001 0 | 0.267 9±0.004 9 | 0.225 0±0.001 2 | 0.419 9±0.255 2 | |
| 20 000 | 20 000 | 0.009 7±0.000 1 | 0.060 6±0.000 2 | 0.180 8±0.000 8 | 0.148 7±0.002 6 | 0.180 9±0.000 9 |
Table 2
KL divergence comparison of five synthetic sample imputation methods based on 10 Gaussian distributions
| 数据集 | 真实样 本点个数 | 仿真样 本点个数 | DGM-SSI | RSI | SMOTE | SMOTE-D | k-means SMOTE |
|---|---|---|---|---|---|---|---|
| 2 000 | 2 000 | 0.001 2±0.000 8 | 0.011 9±0.006 9 | 1.301 3±0.283 3 | 0.224 5±0.040 6 | 0.011 9±0.006 9 | |
| 4 000 | 4 000 | 0.000 9±0.001 3 | 0.011 3±0.013 1 | 4.791 1±2.109 6 | 9.903 4±3.213 9 | 0.011 3±0.013 1 | |
| 4 000 | 4 000 | 0.042 8±0.071 7 | 0.392 1±0.046 2 | 0.130 4±0.055 4 | 0.376 4±0.076 1 | 0.392 1±0.046 2 | |
| 8 000 | 8 000 | 0.009 3±0.008 1 | 0.087 6±0.037 0 | 0.571 7±0.018 4 | 0.199 6±0.064 8 | 0.087 6±0.037 0 | |
| 6 000 | 6 000 | 0.005 3±0.001 1 | 0.051 1±0.005 4 | 0.112 2±0.020 6 | 0.087 4±0.014 9 | 0.051 1±0.005 4 | |
| 12 000 | 12 000 | 0.003 0±0.002 6 | 0.015 2±0.004 4 | 0.120 2±0.005 0 | 0.968 4±0.007 0 | 0.015 2±0.004 4 | |
| 8 000 | 8 000 | 0.001 8±0.000 4 | 0.026 8±0.010 3 | 0.154 7±0.012 0 | 0.236 2±0.006 8 | 0.026 8±0.010 3 | |
| 16 000 | 16 000 | 0.035 5±0.030 5 | 0.023 2±0.000 8 | 0.150 4±0.019 2 | 0.302 1±0.011 9 | 0.023 2±0.000 8 | |
| 10 000 | 10 000 | 0.001 7±0.001 1 | 0.175 9±0.005 5 | 0.127 2±0.023 6 | 0.189 2±0.024 3 | 0.175 9±0.005 5 | |
| 20 000 | 20 000 | 0.001 3±0.000 9 | 0.033 4±0.005 9 | 0.143 2±0.037 4 | 2.536 1±0.087 2 | 0.033 4±0.005 9 |
Table 3
MMD comparison of five synthetic sample imputation methods based on 10 uniform distributions
| 数据集 | 真实样 本点个数 | 仿真样 本点个数 | DGM-SSI | RSI | SMOTE | SMOTE-D | k-means SMOTE |
|---|---|---|---|---|---|---|---|
| 2 000 | 2 000 | 0.014 3±0.007 2 | 0.225 9±0.010 6 | 0.020 4±0.006 5 | 0.148 6±0.013 4 | 0.251 8±0.010 4 | |
| 4 000 | 4 000 | 0.009 8±0.003 3 | 0.274 6±0.004 3 | 0.011 2±0.004 0 | 0.114 9±0.008 3 | 0.317 2±0.011 0 | |
| 4 000 | 4 000 | 0.011 4±0.002 7 | 0.417 7±0.003 0 | 0.013 1±0.004 3 | 0.100 9±0.002 7 | 0.170 2±0.003 3 | |
| 8 000 | 8 000 | 0.008 0±0.001 7 | 0.382 8±0.001 6 | 0.012 0±0.003 1 | 0.171 9±0.004 5 | 0.428 0±0.049 2 | |
| 6 000 | 6 000 | 0.009 3±0.002 6 | 0.472 7±0.001 0 | 0.010 9±0.004 0 | 0.134 3±0.003 0 | 0.418 9±0.007 6 | |
| 12 000 | 12 000 | 0.007 8±0.002 0 | 0.354 9±0.000 7 | 0.009 4±0.001 7 | 0.117 7±0.002 9 | 0.586 8±0.004 4 | |
| 8 000 | 8 000 | 0.009 4±0.003 2 | 0.431 1±0.000 5 | 0.010 9±0.002 8 | 0.145 4±0.003 5 | 0.351 1±0.009 6 | |
| 16 000 | 16 000 | 0.006 4±0.001 4 | 0.506 3±0.000 3 | 0.007 5±0.001 8 | 0.209 7±0.001 6 | 0.564 5±0.001 9 | |
| 10 000 | 10 000 | 0.006 7±0.001 5 | 0.632 8±0.000 4 | 0.008 2±0.002 1 | 0.203 0±0.002 5 | 0.774 5±0.007 0 | |
| 20 000 | 20 000 | 0.006 3±0.001 3 | 0.328 9±0.000 6 | 0.007 2±0.001 0 | 0.078 3±0.002 0 | 0.350 6±0.029 9 |
Table 4
KL divergence comparison of five synthetic sample imputation methods based on 10 uniform distributions
| 数据集 | 真实样 本点个数 | 仿真样 本点个数 | DGM-SSI | RSI | SMOTE | SMOTE-D | k-means SMOTE |
|---|---|---|---|---|---|---|---|
| 2 000 | 2 000 | 0.029 6±0.004 3 | 0.055 0±0.008 2 | 0.077 2±0.008 5 | 3.505 0±0.913 1 | 0.281 5±0.024 1 | |
| 4 000 | 4 000 | 0.017 8±0.001 5 | 0.091 3±0.006 6 | 0.031 1±0.002 9 | 0.232 0±0.032 5 | 0.831 6±0.204 7 | |
| 4 000 | 4 000 | 0.078 8±0.004 4 | 0.110 2±0.035 8 | 0.140 6±0.007 2 | 1.628 3±0.108 4 | 0.259 1±0.040 5 | |
| 8 000 | 8 000 | 0.062 6±0.002 5 | 0.292 3±0.043 1 | 0.084 0±0.003 9 | 1.641 0±0.161 4 | 1.073 5±0.265 2 | |
| 6 000 | 6 000 | 0.147 1±0.002 7 | 0.227 6±0.047 0 | 0.257 1±0.007 9 | 1.882 2±0.252 5 | 0.772 9±0.043 4 | |
| 12 000 | 12 000 | 0.150 4±0.004 2 | 0.235 6±0.077 4 | 0.200 8±0.005 3 | 1.690 6±0.135 9 | 2.810 4±0.081 9 | |
| 8 000 | 8 000 | 0.222 4±0.004 3 | 0.362 6±0.160 1 | 0.362 5±0.013 0 | 2.085 5±0.191 6 | 1.210 4±0.032 6 | |
| 16 000 | 16 000 | 0.188 9±0.007 3 | 0.388 7±0.138 8 | 0.231 2±0.006 0 | 2.276 8±0.109 6 | 1.970 0±0.068 4 | |
| 10 000 | 10 000 | 0.254 1±0.005 4 | 0.492 0±0.280 3 | 0.422 6±0.016 3 | 2.104 5±0.167 5 | 7.501 7±2.246 1 | |
| 20 000 | 20 000 | 0.339 2±0.006 1 | 0.479 6±0.055 9 | 0.439 6±0.009 3 | 1.418 0±0.056 7 | 5.222 6±3.551 1 |
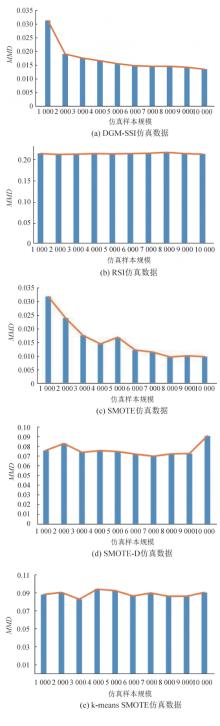
Fig. 9
Impact of synthetic sample size on MMD
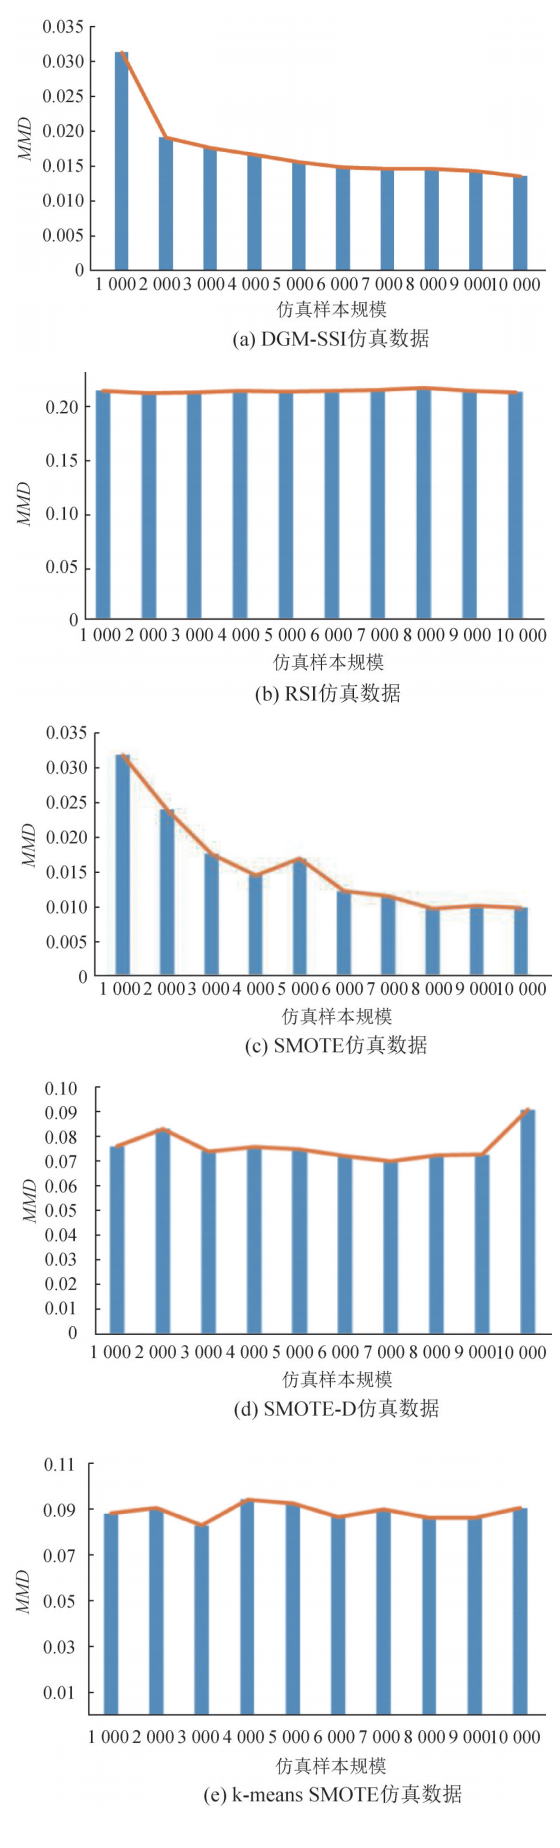
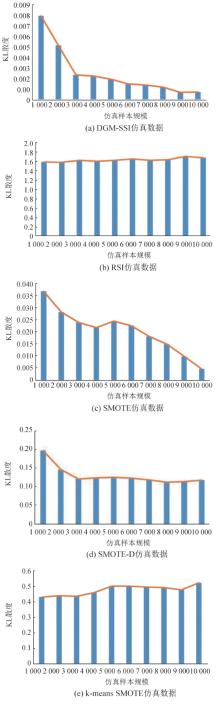
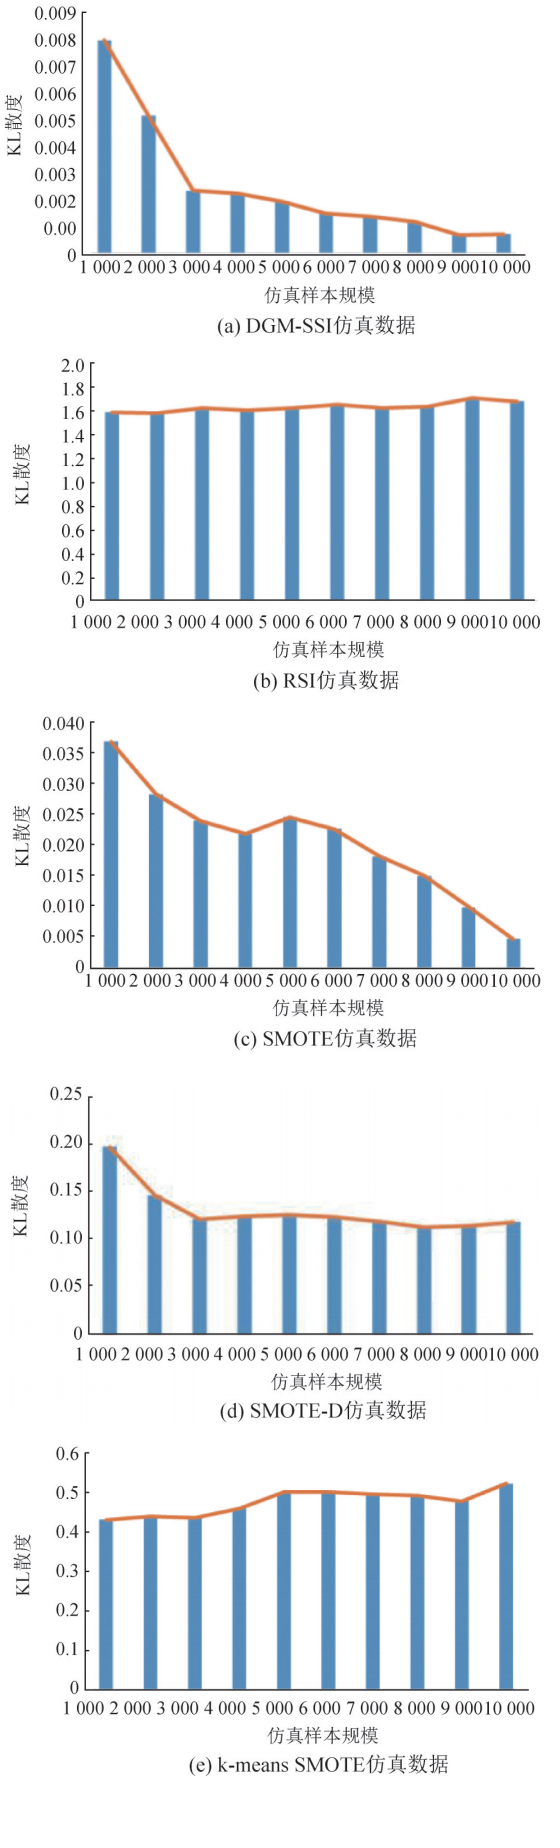
Fig. 10
Impact of synthetic sample size on KL divergence
| 1 | He Haibo, Garcia E A. Learning From Imbalanced Data[J]. IEEE Transactions on Knowledge and Data Engineering, 2009, 21(9): 1263-1284. |
| 2 | 王乐, 韩萌, 李小娟, 等. 不平衡数据集分类方法综述[J]. 计算机工程与应用, 2021, 57(22): 42-52. |
| Wang Le, Han Meng, Li Xiaojuan, et al. Review of Classification Methods for Unbalanced Data Sets[J]. Computer Engineering and Applications, 2021, 57(22): 42-52. | |
| 3 | 李维刚, 甘平, 谢璐, 等. 基于样本对元学习的小样本图像分类方法[J]. 电子学报, 2022, 50(2): 295-304. |
| Li Weigang, Gan Ping, Xie Lu, et al. A Few-shot Image Classification Method by Pairwise-based Meta Learning[J]. Acta Electronica Sinica, 2022, 50(2): 295-304. | |
| 4 | Rathore M M, Shah S A, Shukla D, et al. The Role of AI, Machine Learning, and Big Data in Digital Twinning: A Systematic Literature Review, Challenges, and Opportunities[J]. IEEE Access, 2021, 9: 32030-32052. |
| 5 | 马子轩, 翟季冬, 韩文弢, 等. 高效训练百万亿参数预训练模型的系统挑战和对策[J]. 中兴通讯技术, 2022, 28(2): 51-58. |
| Ma Zixuan, Zhai Jidong, Han Wentao, et al. Challenges and Measures for Efficient Training of Trillion-parameter Pre-trained Models[J]. ZTE Technology Journal, 2022, 28(2): 51-58. | |
| 6 | Malay H. How Much Training Data do You Need?[EB/OL]. (2015-11-29) [2022-02-10]. . |
| 7 | Chawla N V, Bowyer K W, Hall L O, et al. SMOTE: Synthetic Minority Over-sampling Technique[J]. Journal of Artificial Intelligence Research, 2002, 16(1): 321-357. |
| 8 | Fredy Rodríguez Torres, Carrasco-Ochoa Jesús A, Mart José Fco Martínez-Trinidad. SMOTE-D a Deterministic Version of SMOTE[C]//Pattern Recognition. Cham: Springer International Publishing, 2016: 177-188. |
| 9 | Douzas G, Bacao F, Last F. Improving Imbalanced Learning Through a Heuristic Oversampling Method Based on K-means and SMOTE[J]. Information Sciences, 2018, 465: 1-20. |
| 10 | Kovács György. Smote-variants: a Python Implementation of 85 Minority Oversampling Techniques[J]. Neurocomputing, 2019, 366: 352-354. |
| 11 | Fernández Alberto, Sara del Río, Chawla N V, et al. An Insight into Imbalanced Big Data Classification: Outcomes and Challenges[J]. Complex & Intelligent Systems, 2017, 3(2): 105-120. |
| 12 | Fernández Alberto, García Salvador, Herrera F, et al. SMOTE for Learning from Imbalanced Data: Progress and Challenges, Marking the 15-year Anniversary[J]. Journal of Artificial Intelligence Research, 2018, 61(1): 863-905. |
| 13 | Han Hui, Wang Wenyuan, Mao Binghuan. Borderline-SMOTE: A New Over-sampling Method in Imbalanced Data Sets Learning[C]//Advances in Intelligent Computing. Berlin, Heidelberg: Springer Berlin Heidelberg, 2005: 878-887. |
| 14 | 杨智明, 乔立岩, 彭喜元. 基于改进SMOTE的不平衡数据挖掘方法研究[J]. 电子学报, 2007, 35(增2): 22-26. |
| Yang Zhiming, Qiao Liyan, Peng Xiyuan. Research on Datamining Method for Imbalanced Dataset Based on Improved SMOTE[J]. Acta Electronica Sinica, 2007, 35(S2): 22-26. | |
| 15 | 曾志强, 吴群, 廖备水, 等. 一种基于核 SMOTE 的非平衡数据集分类方法[J]. 电子学报, 2009, 37(11): 2489-2495. |
| Zeng Zhiqiang, Wu Qun, Liao Beishui, et al. A Classfication Method for Imbalance Data Set Based on Kernel SMOTE[J]. Acta Electronica Sinica, 2009, 37(11): 2489-2495. | |
| 16 | Ramentol E, Caballero Yailé, Bello R, et al. SMOTE-RSB_*: A Hybrid Preprocessing Approach Based on Oversampling and Undersampling for High Imbalanced Data-sets Using SMOTE and Rough Sets Theory[J]. Knowledge and Information Systems, 2012, 33(2): 245-265. |
| 17 | Pan Tingting, Zhao Junhong, Wu Wei, et al. Learning Imbalanced Datasets Based on SMOTE and Gaussian Distribution[J]. Information Sciences, 2020, 512: 1214-1233. |
| 18 | He Yulin, Xu Shengsheng, Huang Zhexue. Creating Synthetic Minority Class Samples Based on Autoencoder Extreme Learning Machine[J]. Pattern Recognition, 2022, 121: 108191. |
| 19 | Xuan Guorong, Zhang Wei, Chai Peiqi. EM Algorithms of Gaussian Mixture Model and Hidden Markov Model[C]//Proceedings 2001 International Conference on Image Processing. Piscataway, NJ, USA: IEEE, 2001: 145-148. |
| 20 | 邢长征, 赵全颖, 王星, 等. 基于鲁棒高斯混合模型的加速EM算法研究[J]. 计算机应用研究, 2017, 34(4): 1042-1046. |
| Xing Changzheng, Zhao Quanying, Wang Xing, et al. Accelerated EM Algorithm Research Based on Robust Gaussian Mixture Model[J]. Application Research of Computers, 2017, 34(4): 1042-1046. | |
| 21 | 黄哲学, 何玉林, 魏丞昊, 等. 大数据随机样本划分模型及相关分析计算技术[J]. 数据采集与处理, 2019, 34(3): 373-385. |
| Huang Zhexue, He Yulin, Wei Chenghao, et al. Random Sample Partition Data Model and Related Technologies for Big Data Analysis[J]. Journal of Data Acquisition and Processing, 2019, 34(3): 373-385. | |
| 22 | Levina A, Priesemann V. Subsampling Scaling[J]. Nature Communications, 2017, 8(1): 15140. |
| 23 | Chen Y C. A Tutorial on Kernel Density Estimation and Recent Advances[J]. Biostatistics & Epidemiology, 2017, 1(1): 161-187. |
| 24 | Jiang H. Uniform Convergence Rates for Kernel Density Estimation[C]//Proceedings of the 34th International Conference on Machine Learning. Chia Laguna Resort, Sardinia, Italy: PMLR, 2017: 1694-1703. |
| 25 | Gretton A, Borgwardt K M, Rasch M J, et al. A Kernel Two-sample Test[J]. The Journal of Machine Learning Research, 2012, 13: 723-773. |
| 26 | 何玉林, 黄德发, 戴德鑫, 等. 最大均方差异统计量的一般界[J]. 应用数学, 2021, 34(2): 284-288. |
| He Yulin, Huang Defa, Dai Dexin, et al. General Bounds for Maximum Mean Discrepancy Statistics[J]. Mathematica Applicata, 2021, 34(2): 284-288. | |
| 27 | Pérez-Cruz Fernando. Kullback-leibler Divergence Estimation of Continuous Distributions[C]//2008 IEEE International Symposium on Information Theory. Piscataway, NJ, USA: IEEE, 2008: 1666-1670. |
| [1] | Zheng Wu, Yue Zhang, Ze Dong. Outlier Detection During Thermal Processes Based on Improved Gaussian Mixture Model [J]. Journal of System Simulation, 2023, 35(5): 1020-1033. |
| [2] | Qi Cheng, Xiong Weili. A Just-in-time Learning Soft Sensing Modeling Method Based on Bayesian Gaussian Mixture Model [J]. Journal of System Simulation, 2019, 31(8): 1555-1561. |
| [3] | Chen Fangfang, Ji Zhongping. Face Skin Detection and Color Transferring [J]. Journal of System Simulation, 2019, 31(7): 1377-1386. |
| [4] | Zhao Shuai, Shi Xudong, Xiong Weili. A Hierarchical Integrated Soft Sensing Modeling Method for Gauss Process Regression [J]. Journal of System Simulation, 2019, 31(10): 2042-2051. |
| Viewed | ||||||
|
Full text |
|
|||||
|
Abstract |
|
|||||
